
Case Study
Turning "We Have No Idea How Marketing Is Doing" Into One Clear Dashboard
A coaching company running marketing across 8 platforms with no single view of what was actually working.
The Client
They were doing a lot of marketing. They just couldn't see any of it in one place.
A coaching company we worked with was investing heavily in marketing, running campaigns, publishing content, sending emails, posting across social, but had no executive level view of how any of it was performing.
Their data was scattered across Google Analytics, Google Search Console, Meta, YouTube, LinkedIn, Mailchimp, Instagram, and TikTok. Eight platforms, eight dashboards, eight logins, and none of them talking to each other.
The CEO knew they were spending money on marketing. What she couldn’t easily answer was: is it working?
"They weren't short on marketing. They were short on visibility."
The Objectives
They wanted a single place to answer the questions that actually matter:
Three clear goals to turn scattered platform data into one executive level marketing view without requiring the CEO to become a data analyst.
01
See all marketing performance in one place
Across every channel, paid, organic, email, social, and search, without logging into 8 different platforms.
02
Understand what's working and what's not
Not just raw numbers but clear signals on which channels are driving results and which are burning budget.
03
Stop relying on manual reporting and team updates
Get a living, always current view instead of waiting for someone to pull together a monthly deck.
The Challenge: Eight Platforms, Zero Clarity
Before this system, understanding marketing performance meant checking 8 platforms one by one
The CEO would ask the team how marketing was going and get a different answer depending on who she asked and which platform they were looking at.
Google Analytics told one story. Meta Ads Manager told another. Mailchimp had open rates but no revenue connection. YouTube and TikTok had views and subscribers but no way to compare them side by side with LinkedIn or Instagram.
When leadership needed a marketing update, someone had to manually pull data from each platform, paste it into a spreadsheet or deck, and try to make it all make sense. That process took hours and by the time it was done, the numbers were already stale.
The real cost wasn’t just time. It was decisions made without the full picture, budget allocated by gut feel, channels kept running out of habit, and wins going unnoticed because nobody could see them.
The Solution
One unified marketing dashboard pulling from every platform in real time
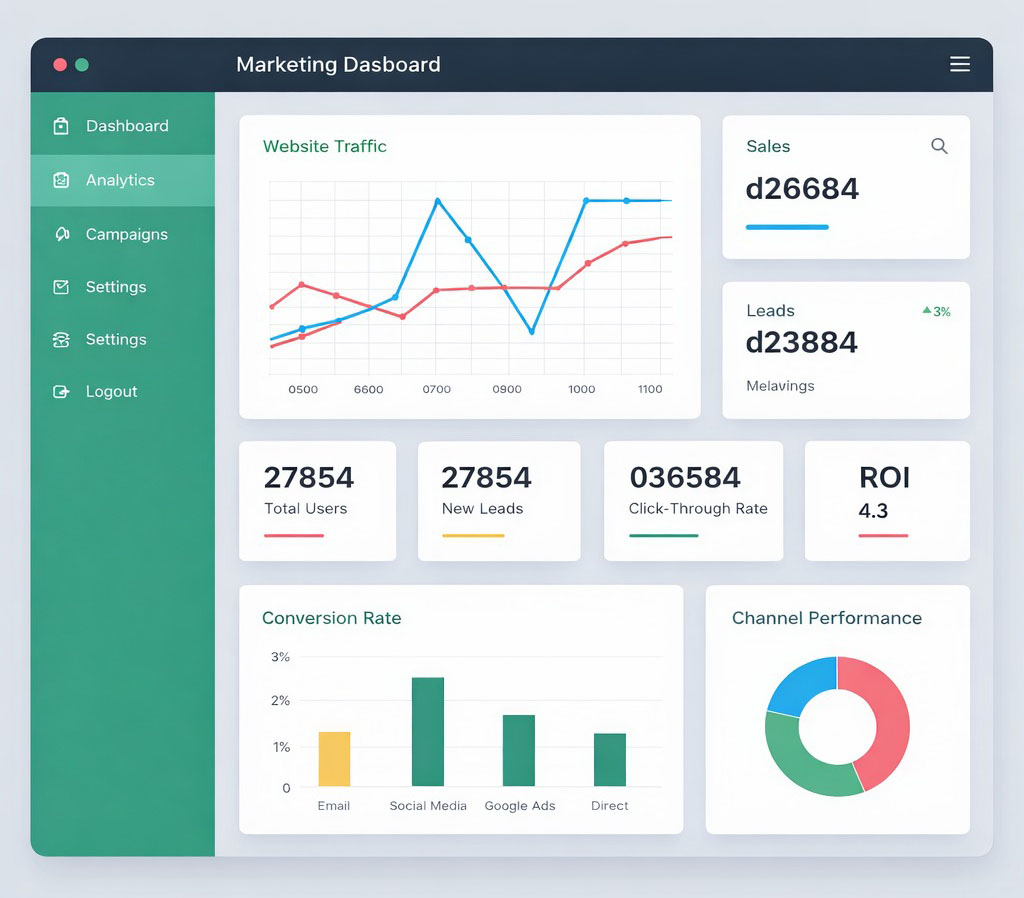
One Thing Simpler built a centralized dashboard that connects to all 8 marketing platforms, giving the CEO and her team a single, always current view of everything.
Google Analytics + Google Search Console
Website traffic, top pages, search performance, keyword rankings, and user behavior unified and summarized.
Meta + Instagram
Ad spend, reach, engagement, cost per lead, and campaign performance across both paid and organic.
YouTube + TikTok
Video views, subscriber growth, engagement rates, and content performance side by side in one view.
Post performance, follower growth, engagement, and reach tracked alongside every other channel.
Mailchimp
Email open rates, click through rates, list growth, and campaign performance connected to the bigger picture.
What Changed
What they can do now
Result 01
A single executive view of all marketing
For the first time, the CEO can open one dashboard and see performance across all 8 platforms, paid ads, organic social, email, search, and video, in a single view.
Instead of asking the team “how’s marketing going?” she can now see for herself:
What channels are driving the most traffic and leads? Where is ad spend going and what’s the return? Which content is performing and which isn’t? How are email campaigns comparing to social and search?
Result 02
No more manual reporting
The team used to spend hours pulling data from each platform to compile marketing updates. Now the dashboard does it automatically, always current, always accurate.
Before
2 -4 hours / month
After
0 minutes / month
Result 03
Smarter budget decisions backed by real data
With every channel visible in one place, the CEO can now see exactly where money is working and where it’s not. Budget conversations shifted from opinion based to evidence based.
Instead of “I think TikTok is doing well,” the team can now say: “Youtube drove 3x the engagement of LinkedIn this month at half the cost per lead.”
Result 04
The team got their time back
Marketing team members no longer spend time logging into platforms, exporting CSVs, or building manual reports. They spend that time on what they were hired to do, creating and optimizing campaigns.
Result 05
8 platforms - 1 View
Unified into one view: Google Analytics, Google Search Console, Meta, YouTube, LinkedIn, Mailchimp, Instagram, and TikTok.
Result 06
Real time Results
Marketing performance is always current, no more stale monthly reports or outdated decks.
The Takeaway
They didn't need to do more marketing. They needed to see the marketing they were already doing.
By building one unified dashboard across 8 platforms, the CEO went from “I think marketing is going well” to knowing exactly what’s working, what’s not, and where to invest next.
All without changing a single tool or adding a single manual step.
Seeing everything in one place
every channel, every metric, every platform unified.
Making decisions with confidence
budget, strategy, and priorities backed by real data, not gut feel.
Freeing the team to do real work
no more manual reporting, more time on campaigns that move the needle.